Introducing the LOGG Stack: Rewriting a Legacy Monitoring System
Many moons ago, in a Network Operations Center (NOC) not so far away, I took on the challenge of writing a system that would be the best thing since sliced bread when it came to monitoring a collection of DOCSIS cable modem networks. The system had to be multi-tenant and able to scan thousands of cable modems and their host routers in the most efficient way possible at least every 15 minutes. The 15-minute limit was set by nothing more than the technology stack I used to build it, and even that was pushing what it could do.
For that project, I used a LAMPP stack. You will notice that my stack has two Ps. This is because while I used Linux, Apache, MySQL, and PHP for the front end, Perl drove the back end. I have to give credit where credit is due; I did not write the front end. My good friend Ed Link wrote the front end while I worked out how to process and store this much data on the tech stack we had available then. There was a bit of Ajax in there to give it some dynamics but it was generally built how things were built at the time. Perl processed and wrote the data to the databases and RRD files. PHP read the data from MySQL, connected the correct profile with the correct data file, and rendered the page full of information about the user and their modem.
Though it has been updated many times since I left, this piece of software is still in operation. I know; I use it daily. Isn't it funny how life does that sometimes? I am now the end user of a SaaS that I wrote over a decade ago. I use it daily in my current day job. And the longer I have used it, the longer I have yearned to rewrite, well, all of it, from the ground up.
I had become pretty good with Perl over all of those years. At first, I thought, well, I'll just write a better Perl version, move the front end to Bootstrap and NodeJS, move the data store to OpenSearch, and have this done in a weekend. I rewrote big chunks of it from memory. Then, I ran the speed test to scan about 2500 modems, it still took 15 minutes. I was back to the exact same limit as the original version. I went as far as running the scans in 50 forks so it would do 50 modems at a time. This improved the speed somewhat but put a massive load on the VM that was doing the polling; we are talking loads of 40+ on an 8-core VM. I needed to rethink this.
Enter Go and the LOGG Stack
This is where Go comes into the picture. Despite my love for Perl, its forking mechanism, which duplicates the entire memory structure for each fork, was a system killer. Moreover, communication between multiple workers was cumbersome, and the lack of a comprehensive OpenSearch2 module for Perl compounded the problem.
Of course, since OpenSearch is a REST interface, I could have written functions to run HTTP commands using readily available HTTP Perl modules. But this was more about threading than absolutely having to have an OpenSearch module. Perl's threading model, with its full-memory forking, just wasn't up to the task for this high-frequency, high-volume polling system.
Go offered solutions to both issues. Unlike Perl, Go handles concurrency efficiently with goroutines, lightweight threads that make it easy to run multiple operations simultaneously without the overhead of traditional forking. Moreover, Go's strict typing and memory management ensure optimal performance and reliability.
Starting this project 7 days ago, I had played with Go and tried to write a few hobby projects with it with limited success. However, I always fell back on Perl and JavaScript because I could write code faster. Why? Neither one of them is strictly typed. Even Perl, with its "use strict;" option, will let you define global variables everywhere. Go says, no, you can't do that; you need to treat my memory right. So you have to learn how structs work and pointers, which are much like a Perl ref, like a hash ref, array ref, or any other ref you build. But in Go, it wants to know exactly where and why you are putting something where you are. And I struggled with that for a few days.
Embracing the LOGG Stack
Go is just one part of the new stack I am using for this project. I call it the LOGG stack: Linux, OpenSearch, Go, and Grafana. While Linux remains the backbone, OpenSearch will handle data storage, Go will be the new workhorse for data processing, and Grafana will provide the visualization layer.
Why OpenSearch?
OpenSearch offers powerful search and analytics capabilities that are perfect for the large datasets this monitoring system will handle. It allows for real-time data ingestion and querying, which is crucial for monitoring network performance.
Why Grafana?
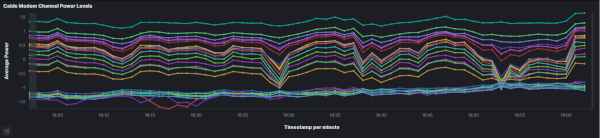
Grafana is an excellent tool for data visualization, making it easy to create dashboards that provide insights into network health and performance. It integrates seamlessly with OpenSearch, making it the perfect choice for this project.
The Journey Ahead
This blog series will document my journey as I rewrite this legacy system using the LOGG stack. I'll share the challenges, successes, and lessons learned along the way. Whether you're a seasoned developer or just starting, I hope this series will provide valuable insights into using Go and the LOGG stack for building efficient, scalable systems.
Stay tuned for the next post, where I'll dive into the specifics of setting up the project, handling SNMP polling with Go, and integrating with OpenSearch. This is just the beginning, and I am excited to take you along on this journey of rewriting a legacy system with modern technology.
By following along with this blog series, you'll see how I overcome various challenges, optimize performance, and leverage the power of Go and the LOGG stack to create a robust monitoring solution. Let's get started!
This is Not the End,
This is The Beginning,
--Bryan