Recovering the Metrics Stack After Quick Shutdown
Last night we had a power drop, and this morning, when bringing the CodexMCP stack back up, Grafana was blank. Here’s the step-by-step process I used to debug and recover the metrics stack.
Step 1: SSH to the logging server
Used my SSH selector script:

bash sshto.sh
Picked:
1) logs-core-1 10.0.1.100
Step 2: Check if Logstash is running
ps -ax | grep logstash
Saw:
1516 ? SNsl 1:40 /usr/share/logstash/jdk/bin/java ... org.logstash.Logstash --path.settings /etc/logstash
2883 pts/2 S+ 0:00 grep --color=auto logstash
Logstash process is running (PID 1516).
Step 3: Check Logstash logs for errors
tail -f /var/log/logstash/logstash-plain.log
Saw:
Attempted to resurrect connection to dead OpenSearch instance, but got an error {:url=>"http://admin:xxxxxx@10.0.1.23:9200/", :exception=>LogStash::Outputs::OpenSearch::HttpClient::Pool::HostUnreachableError, :message=>"OpenSearch Unreachable: [http://admin:xxxxxx@10.0.1.23:9200/][Manticore::SocketException] Connect to 10.0.1.23:9200 failed: Connection refused"}
Logstash running, but OpenSearch cluster not reachable.
Step 4: SSH to OpenSearch cluster node
bash sshto.sh
Picked:
3) os-core-1 10.0.1.21
Connected:
Welcome to Ubuntu 24.04.2 LTS (GNU/Linux 6.8.0-60-generic x86_64)
...
codexmcp@os-core-1:~$
Step 5: Check if OpenSearch is running
ps auxww | grep opensearch
Saw:
codexmcp 2437 0.0 0.0 6544 2304 pts/0 S+ 08:52 0:00 grep --color=auto opensearch
OpenSearch process NOT running.
Step 6: Start OpenSearch manually
sudo service opensearch start
Then repeated on:
os-core-2 (10.0.1.22)
os-core-3 (10.0.1.23)
Step 7: Wait for recovery
Expected, OpenSearch takes time after a dirty shutdown (shard recovery, translog replay, cluster state check).
Step 8: Verify OpenSearch is running and cluster is healthy
curl localhost:9200
Saw:
{
  "name" : "os-core-1",
  "cluster_name" : "codexmcp-cluster",
  "version" : {
    "distribution" : "opensearch",
    "number" : "2.19.0",
    ...
  }
}
And:
curl localhost:9200/_cat/nodes
Saw:
10.0.1.21 ... os-core-1
10.0.1.22 ... os-core-2
10.0.1.23 ... os-core-3
All nodes online.
Step 9: Check Grafana
Pulled up Grafana — dashboard is back:
Kea DHCP logs backfilled (because Logstash PQ was enabled)
System load only from after OpenSearch came up (because those metrics write direct to OpenSearch)
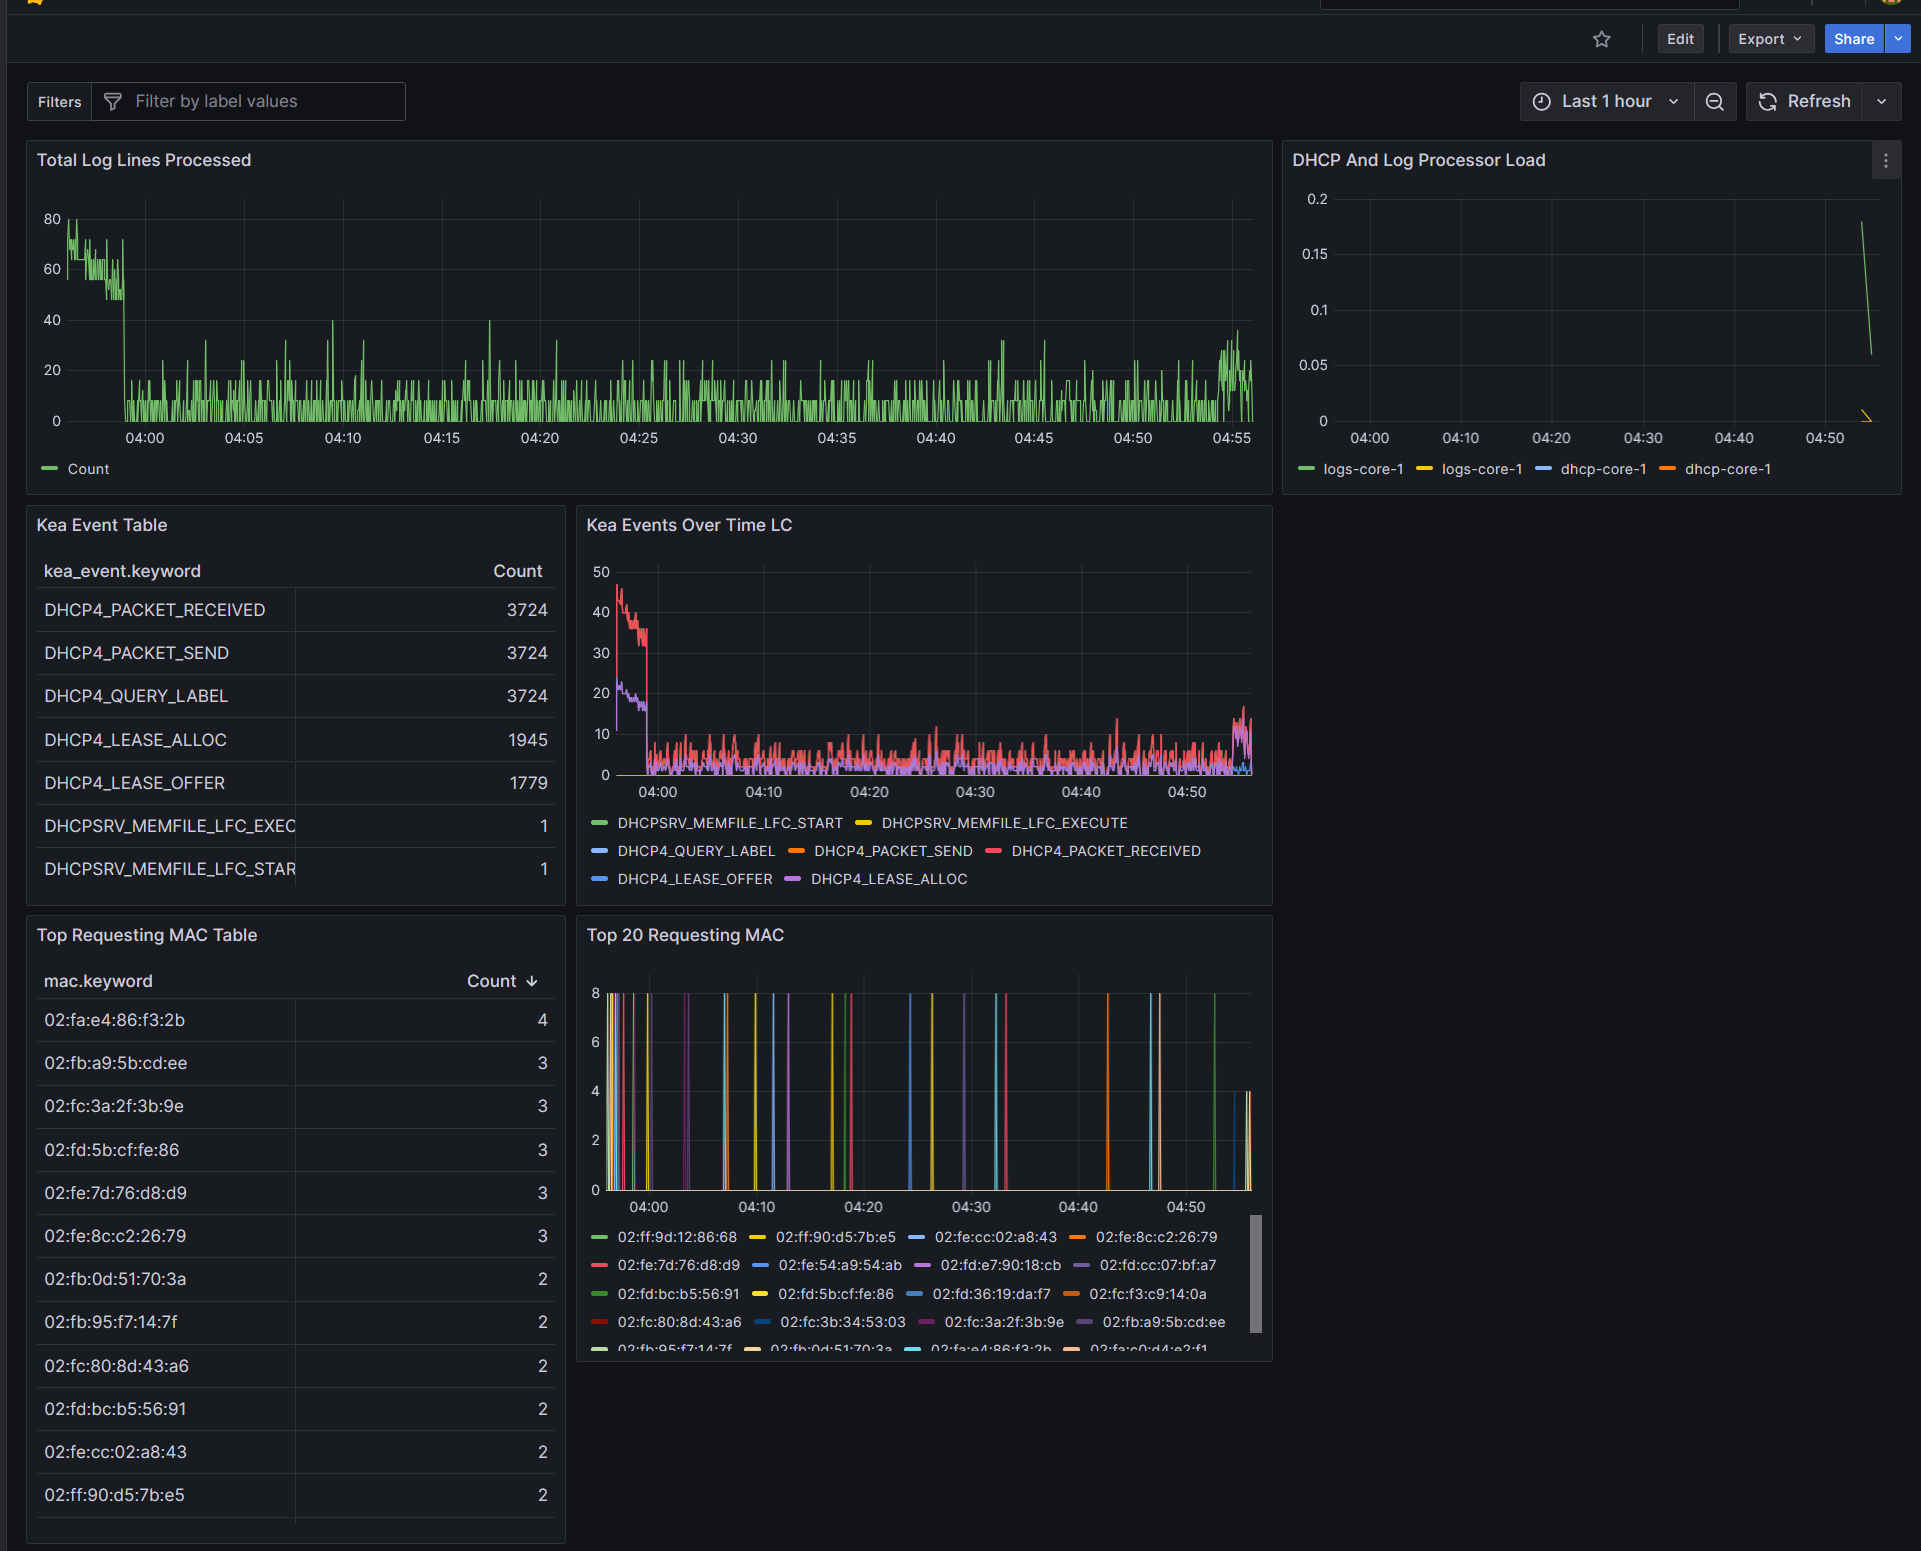
You can see the spike just before 04:00 when I launched the 1102 simusers to churn leases.
The Final Fix
When I built this cluster, I knew I needed to enable OpenSearch in systemd so it would auto-start on system boot, it just got lost in the shuffle somewhere. Now it’s fixed.
The command to enable it:
sudo systemctl enable opensearch
That way OpenSearch will start automatically after any future shutdown or reboot. This is also added to my notes for the CodexMCP VM Launcher.
Summary
- Logstash recovered on its own (with PQ enabled)
- OpenSearch required a manual start after a dirty shutdown
- Cluster took the expected time for shard recovery
- No log data lost — PQ saved it
- Metrics that bypass Logstash show expected gap
- Stack fully back, Grafana live again
- OpenSearch will start automatically in the future.
--That's Enough For Today
-Bryan