The Fourth Dimension of Data

Most people look at a dashboard and see a collection of panels. A few charts, some graphs, maybe a live table or a map. Two dimensions. Something you look at.
But that is not how I see it.
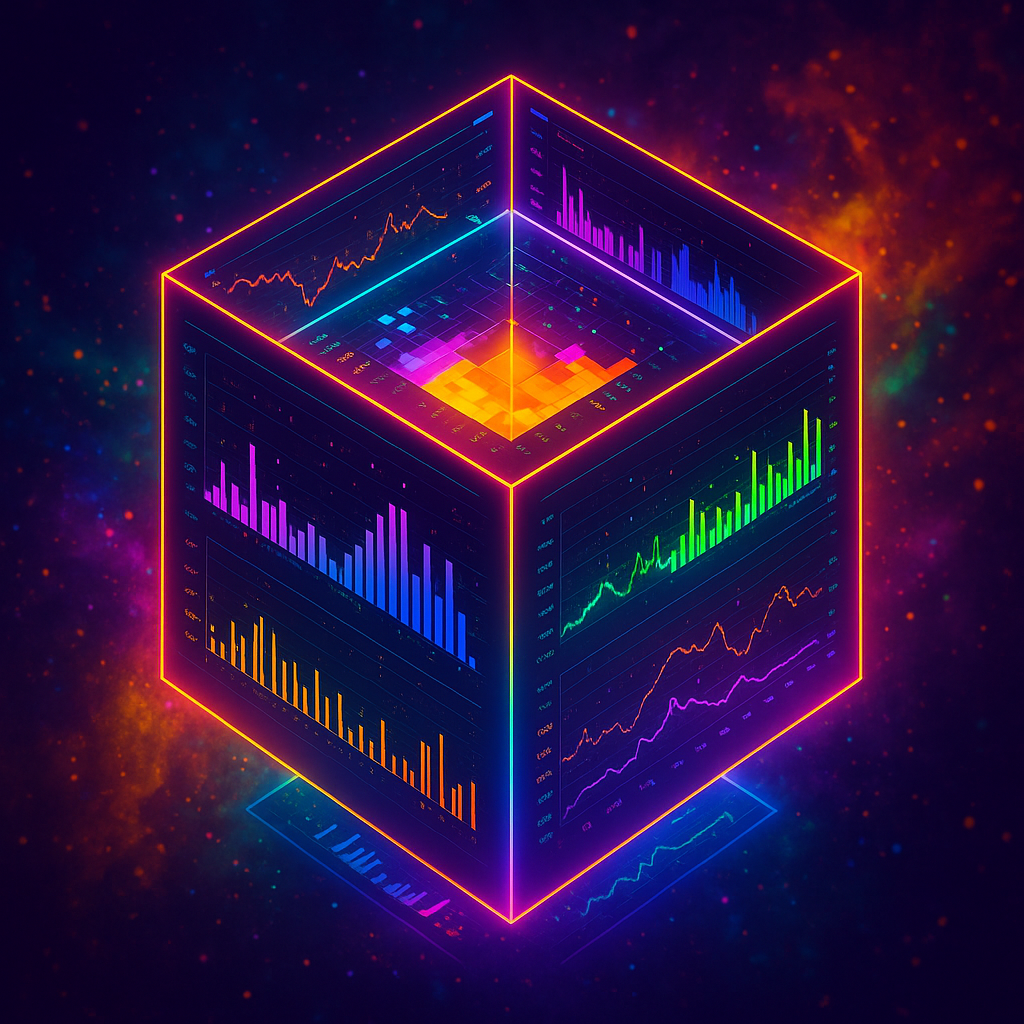
When I am deep inside a network, watching ONT logs, SS7 call traces, DSL syncs, optical levels, and customer endpoints all move together, it stops feeling like a dashboard. It feels like a rotatable cube. A living model of everything happening in that system, across space, across time, across cause and effect.
Each data point is not just a number. It is an event, a relationship, a moment. It has neighbors, context, and gravity. And when you can pivot through those relationships quickly enough, the entire thing becomes spatial. You are no longer scrolling through metrics. You are navigating an environment.
Click a link, filter a subset, merge a field, aggregate a pattern. Each one is another rotation of that cube. You are not drilling down. You are moving through dimensions.
I build dashboards that move like that. They are not about making things pretty. They are about moving through information as naturally as you would move through a room. They are instruments of function, motion, and truth.
The Fourth Dimension
Dimension one is the static metric, the literal number.
Dimension two is the relationship between those metrics, the visual plane where comparisons live.
Dimension three is time, the motion between states.
Dimension four is correlation, the invisible architecture connecting everything.
Once you start working in that fourth dimension, old dashboards start to look primitive. A five-minute poll is not visibility. It is a shadow of what already happened. Real awareness happens when you can see cause and effect unfolding as it occurs.
That is the shift. From static monitoring to living systems.
Do We Really Stop at Four?
When I say four dimensions, I am simplifying. In truth, it does not stop there. The deeper you get into real data, the more dimensions begin to emerge.
Every metric has dependencies, patterns, behavioral fingerprints, and human context. If you start counting the ways those interact, you are no longer in four dimensions. You are in something closer to multi-dimensional cognition, where each new connection spawns another axis of understanding.
A network, when visualized fully, is not a cube at all. It is a cloud of overlapping realities. Physical signal paths, logical routes, service policies, customer behaviors, historical anomalies, predictive probabilities. Each layer exists simultaneously. The human brain collapses it into something we can visualize, but the data itself does not live in two or three or four dimensions. It lives in something larger than we can picture, and we navigate it instinctively when the tools stop slowing us down.
That is what I am really building when I say a dashboard. It is not an interface. It is an extension of perception. A way for the human mind to move through more dimensions of reality than the senses allow.
Rethinking Data
We are entering a time where data will no longer sit still. It will move, interact, and respond. The question is not how we will visualize it, but how we will think within it.
If your tools let you manipulate thousands of data points instantly, if you can pivot between context and correlation without losing your sense of place, you are not just analyzing. You are experiencing. You are interacting with a living model of your own environment.
That is not analytics. That is dimensional intelligence.
When I rotate that cube, I can watch a packet’s entire story unfold. From ONT to PON, from softswitch to trunk, through a route, into a call trace, all connected, all alive. It is not reporting. It is cognition.
The Road Ahead
At some point, every serious operator, engineer, and analyst will have to leave the comfort of the 2D dashboard. The networks are too complex, the data too fast, and the decisions too important.
We do not need more charts. We need systems that think spatially. Tools that allow a human to experience data in motion.
Four dimensions are only the start. Once the interface becomes as fast as thought, the data stops being a product and starts being a landscape.
The fourth dimension is not science fiction. It is what happens when you stop looking at your data and start living inside it.
--Always Thinking
-Bryan